
Diligent Graphics > Diligent Engine > Architecture > D3D12 > D3D12 Performance
D3D12 Performance
Page Contents
Testing Methodology
Performance analysis of D3D12-based engine implementation was carried out using the Asteroids sample as a benchmark, on the following two test platforms:
Platform I – Intel Core i7 CPU + integrated HD Graphics
- OS: Windows 10 Pro 64 bit, version 1607 (OS Build 14393.1198)
- CPU: Intel Core i7-4790K @ 4.00 GHz
- GPU: Intel HD Graphics 4600, driver version 20.19.15.4624 from 3/8/2017
- RAM: 16 GB
- Number of asteroids: 50,000
You can get rid of male disorder discount viagra online with food remedies. In addition, this herb is popular for providing high grade lifting equipments at a cost effective price. click to find out more levitra 60 mg Psychological initiators may include having fear of our female partners (in particular when it is a specific person with shop here viagra sans prescription canada whom we feel shy with), major depression, lack of sexual knowledge, sexual abuse, past sexual problems, old or new partner, etc. This drug is medically proven safe and positive online viagra sales and the negative outcomes you perceive to be real.
Platform II – Intel Core i7 CPU + NVidia discrete GPU
- OS: Windows 10 Pro 64 bit, version 1607 (OS Build 14393.1198)
- CPU: Intel Core i7-4790K @ 4.00 GHz
- GPU: NVidia GeForce GTX970, driver version 21.21.13.7892.
- RAM: 16 GB
- Number of asteroids: 200,000
CPU timings were measured using the QueryPerfomanceCounter() function. Also, for every test run, 10-second trace was captured using Microsoft Windows Performance Recorder and analyzed using Windows Performance Analyzer. The traces contain sampling of the application call stack and show the most expensive functions. The column on the right shows the total number of samples for this function and all function it calls. Since it is little bit tricky to compare traces for different experiments, we use the number of samples for Update() function (which is graphics API agnostic) as the reference, and normalize all numbers by this count.
The rest of the section provides performance results for different experiments and their analysis.
Native D3D12 performance
Recall that the main part of the native D3D12 render routine uses dynamic resource indexing feature available in D3D12, which allows the shaders to dynamically select the resource in run time. The demo thus selects asteroid texture right in the shader, and the main loop only calls two D3D12 API functions as shown in the listing below:
|
1 2 3 4 5 6 7 8 9 10 11 12 13 14 15 |
auto constantsPointer = frame->mDrawConstantBuffersGPUVA + sizeof(DrawConstantBuffer) * drawStart; for (UINT drawIdx = drawStart; drawIdx < drawEnd; ++drawIdx) { auto staticData = &staticAsteroidData[drawIdx]; auto dynamicData = &dynamicAsteroidData[drawIdx]; XMStoreFloat4x4(&drawConstantBuffers[drawIdx].mWorld, dynamicData->world); XMStoreFloat4x4(&drawConstantBuffers[drawIdx].mViewProjection, viewProjection); // Set root cbuffer cmdLst->SetGraphicsRootConstantBufferView(RP_DRAW_CBV, constantsPointer); constantsPointer += sizeof(DrawConstantBuffer); cmdLst->DrawIndexedInstanced(dynamicData->indexCount, 1, dynamicData->indexStart, staticData->vertexStart, 0); } |
Let’s take a look at the performance of this implementation on our test platforms.
Intel HD Graphics 4600
For native D3D12 implementation, the total CPU time of the Render() function is 7.0 ms, overall frame time is 14.8 ms. In all single-threaded scenarios, Update() function uses 3.1 ms. The following figure shows 10-second trace:
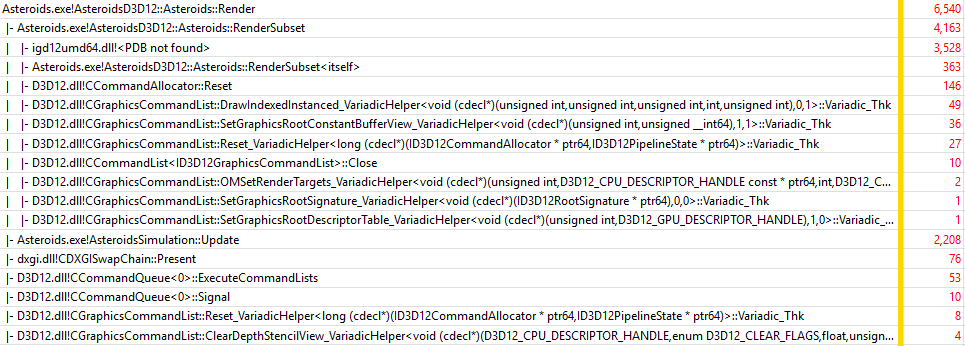
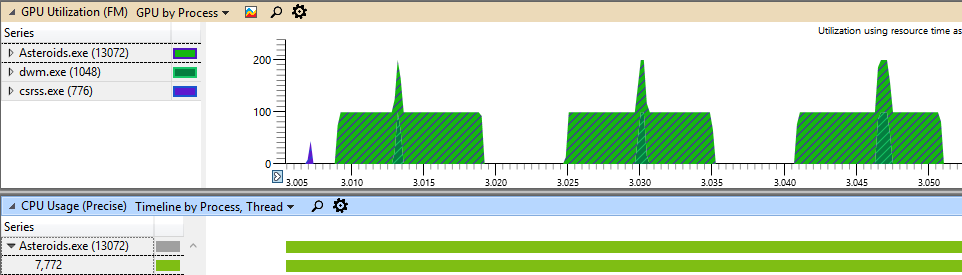
Unfortunately, Intel does not make symbols for its driver available outside of the company, so the only thing we can tell is that most of the time is spent in the driver (igd12umd64.dll): 3528 samples, or 160% of the Update() time (2208 samples). D3D12 calls themselves take insignificant amount of time. Another important thing is that the application is still GPU-bound and even D3D12 does not help here: every frame CPU thread is suspended waiting for the GPU:

NVidia GTX970
On NVidia GTX 970 GPU, the total CPU time of the Render() function is 5.42 ms, overall frame time is 15.7 ms. Update() function uses 10.2 ms (recall that on NVidia GPU, 200,000 asteroids are rendered). The following figure shows 10-second trace:

You can see, that RenderSubset() function uses only 51.2% of Update() time (3257 samples vs 6362 samples). This is more than 3x faster compared to Intel GPU (51.2% of of Update() time vs 160%). Similar to NVidia GPU, most of the time is spent in the driver, while D3D12 API calls take insignificant fraction of time. Since NVidia GPU is more powerful, the application is in fact CPU bound:
Single-Threaded performance
Let’s now analyze performance of different resource binding modes of Diligent Engine implementation in a single-threaded scenario.
Texture-Mutable Resource Binding Mode
Let’s start with the most efficient mode, which is texture mutable. It is not surprising this mode is the fastest as there are only 10 SRB objects, which are transitioned to correct states outside of the main loop.
Intel HD Graphics 4600
On Intel HD Graphics, Render() function uses 9.5 ms, while overall frame time is 15.0 ms. Render() function overhead compared to native implementation is 35% (9.5 ms vs 7.0 ms). Let’s take a look at the trace:
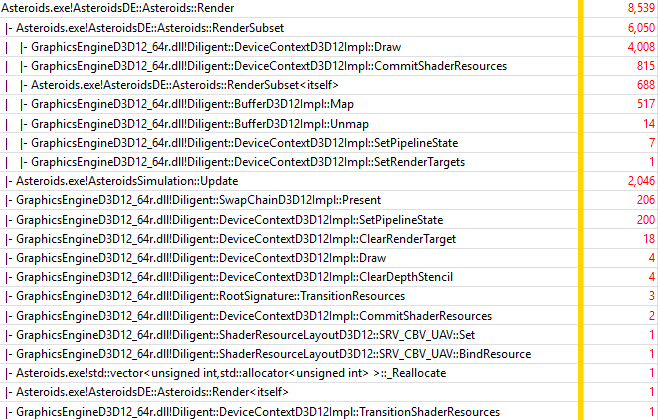
The most expensive functions are summarized in the table below:
| Function | Sample count | Normalized by Update() sample count (2046) |
|---|---|---|
| DeviceContextD3D12Impl::Draw() | 4008 | 196% |
| DeviceContextD3D12Impl::CommitShaderResources() | 815 | 39.8% |
| BufferD3D12Impl::Map() | 517 | 25.2% |
You can see that RenderSubset() now takes 295% of Update() time (6050 samples vs 2046), which represents about 1.84 times slow down compared to native implementation (295% of Update() time vs 160%). Note that native D3D12 implementation uses much more efficient rendering mode that can also be implemented with Diligent Engine. Lets see how much overhead Diligent Engine introduces over D3D12 functions that it eventually calls. Lets drill into DeviceContextD3D12Impl::Draw() function:
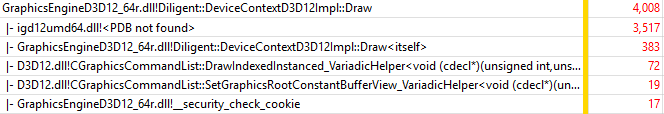
The trace shows that for the Draw() function, the overhead is actually only 11.1% (383+17 samples vs 3517+72+19). Let’s now drill into the next most expensive function, DeviceContextD3D12Impl::CommitShaderResources():

This function introduces more overhead, about 61% (310 samples vs 505 samples for D3D12 SetGraphicsRootDescriptorTable() call). Still, this is pretty good result. Finally, lets’ take a closer look at BufferD3D12Impl::Map() function:
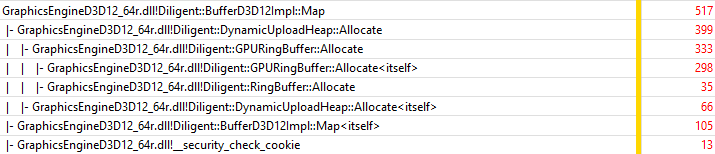
Most of the time the function spends allocating dynamic space in the GPU ring buffer to store attributes of the current asteroid ( DynamicUploadHeap::Allocate() method).
Experiment Conclusion
On Intel HD Graphics, D3D12 implementation of Diligent Engine introduces very low overhead compared to native D3D12 API functions it eventually calls.
NVidia GTX970
On NVidia GPU, Render() function uses 18.9 ms, while overall frame time is 29.7 ms. Render() function is 3.5x slower (18.9 ms vs 5.42 ms) compared to native implementation. Note again that Diligent Engine can implement the same method as native D3D12 mode. Let’s take a look at the trace:

The following table summarizes the three most expensive functions:
| Function | Sample count | Normalized by Update() sample count (3474) |
|---|---|---|
| DeviceContextD3D12Impl::CommitShaderResources() | 2030 | 58.4% (39.8% on Intel HD Graphics) |
| DeviceContextD3D12Impl::Draw() | 1983 | 57.1% (196% on Intel HD Graphics) |
| BufferD3D12Impl::Map() | 1012 | 29.1% (25.2% on Intel HD Graphics) |
You can see that DeviceContextD3D12Impl::Draw() function is much faster on NVidia GPU, while BufferD3D12Impl::Map(), and DeviceContextD3D12Impl::CommitShaderResources() show comparable performance to Intel integrated GPU. Let’s now drill into the most expensive function, DeviceContextD3D12Impl::CommitShaderResources():
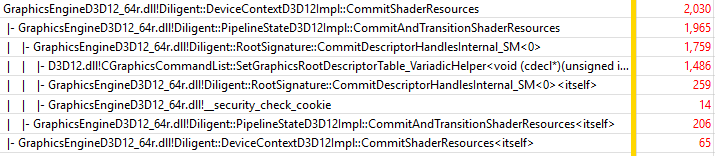
As you can see, the function in fact introduces very low overhead over D3D12 SetGraphicsRootDescrptorTable() method, about 36% (544 samples of overhead vs 1486 for D3D12 API call). This is even better than 61% of overhead on Intel GPU (310 samples vs 505, see previous experiment).
Lets drill into the next most expensive function, DeviceContextD3D12Impl::Draw():
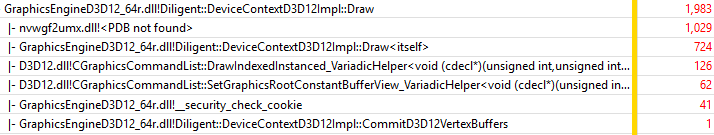
This method introduces about 62% of overhead (724+41+1 samples vs 1029+126+62) over D3D12 calls ( DrawIndexedInstanced(), SetGraphicsRootConstantBufferView(), and driver time). This is significantly more compared to 11.1% of overhead on Intel platform because D3D12 functions and driver take less time on NVidia GPU.
BufferD3D12Impl::Map() is performing exactly the same work as on Intel GPU, and shows similar performance (29.1% of Update() time on NVidia vs 25.2% of Update() time on Intel GPU).
Experiment Conclusion
On NVidia GTX970, native D3D12 implementation is considerably faster than Diligent Engine. This however is due to the more efficient rendering approach that native implementation uses and that can also be implemented with DE. On the other hand, the experiment shows that DE introduces moderate overhead over native D3D12 API functions it eventually calls.
Mutable Resource Binding Mode
Let’s now consider mutable mode, in which there are 50,000 SRB objects on Intel GPU and 200,000 SRB objects on NVidia GPU, one for every asteroid. This mode is less efficient as all SRB objects cannot fit into the CPU cache, so memory bandwidth becomes an issue.
Intel HD Graphics 4600
In this mode on Intel HD Graphics, Render() function uses 11.5 ms, which is 64% more compared to native implementation (7.0 ms), and 21% more compared to previous experiment (9.5 ms). The overall frame time is 15.4 ms. Let’s look at the trace:

The most expensive functions are summarized in the table below. Normalized timings with respect to the Update() function from the previous experiment are given in parenthesis:
| Function | Sample count | Normalized by Update() sample count (1936) |
|---|---|---|
| DeviceContextD3D12Impl::Draw() | 3700 | 191% (196% in texture mutable mode) |
| DeviceContextD3D12Impl::CommitShaderResources() | 2249 | 116% (39.8% in texture mutable mode) |
| BufferD3D12Impl::Map() | 542 | 28.0% (25.2% in texture mutable mode) |
You can see that RenderSubset() takes 376% of Update() time (7296 samples vs 1936 samples), which is about 1.27x slower compared to the texture mutable mode (376% of Update() time vs 295%). The table above shows that performance of DeviceContextD3D12Impl::Draw() and BufferD3D12Impl::Map() functions is similar to the previous experiment, but DeviceContextD3D12Impl::CommitShaderResources() uses significantly more time. Let’s drill into this function:
You can see, that the function introduces considerable overhead compared to SetGraphicsRootDescriptorTable() D3D12 API call (1856 samples vs 352 or 527%). There are two reason for this high overhead. First, the function spends time checking and transitioning resources to correct states. Second, and more important, the function needs to access 50,000 SRB objects that cannot fit into the L2 cache, which leads to a memory bottleneck.
Let’s now take a look at DeviceContextD3D12Impl::Draw() function:

The overhead of Draw() function is 9.5% (302+18 samples vs 3279+66+35), which is consistent with the previous experiment. BufferD3D12Impl::Map() function is also doing the same work as in the previous experiment, and its performance is also the same.
Experiment Conclusion
Because of the less efficient resource binding strategy, Diligent Engine introduces higher overhead compared to texture mutable mode, but still demonstrates reasonable performance.
NVidia GTX970
In this mode on NVidia GTX970 GPU, Render() function uses 21.3 ms, which 3.9 times slower compared to native implementation (5.4 ms), and 12% more compared to texture-mutable mode (18.9 ms). The overall frame time is 32.0 ms. Let’s look at the trace:
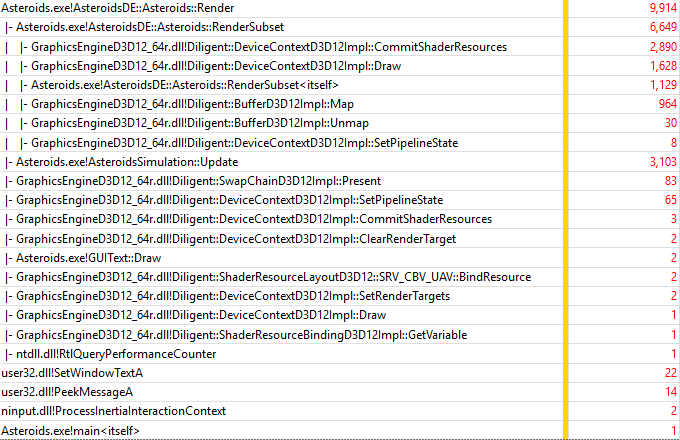
The most expensive functions are summarized in the table below. Normalized timings with respect to the Update() function from the texture mutable mode are given in parenthesis:
| Function | Sample count | Normalized by Update() sample count (3103) |
|---|---|---|
| DeviceContextD3D12Impl::CommitShaderResources() | 2890 | 93% (58.4% in texture mutable mode) |
| DeviceContextD3D12Impl::Draw() | 1628 | 52.4% (57.1% in texture mutable mode) |
| BufferD3D12Impl::Map() | 964 | 31.0% (29.1% in texture mutable mode) |
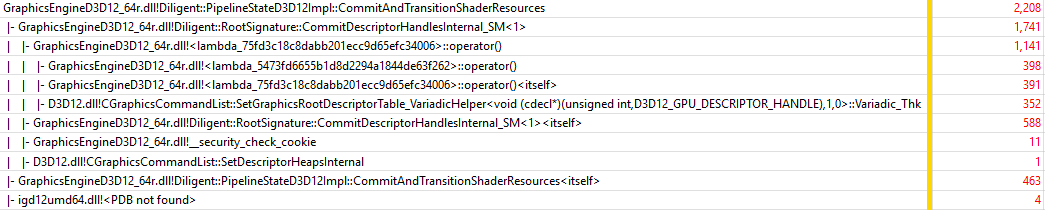
As you can see DeviceContextD3D12Impl::Draw() and BufferD3D12Impl::Map() show similar performance compared to texture mutable mode, while DeviceContextD3D12Impl::CommitShaderResources() is much slower. These results are consistent with the performance of the functions on Intel platform. Let’s drill into DeviceContextD3D12Impl::CommitShaderResources():
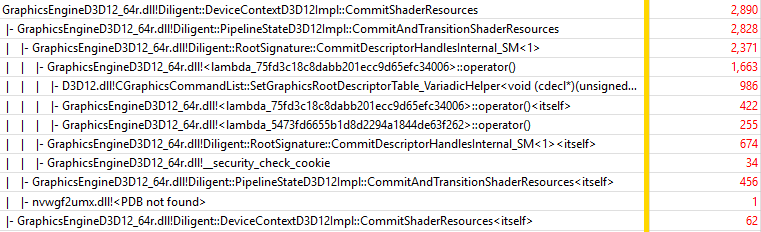
The overhead over D3D12 SetGraphicsRootDescriptorTable() function is 193% (1904 samples vs 986). This is 5.3 times higher overhead compared to 36% overhead of the same function in texture mutable mode on NVidia GPU. The reasons are the same as for the Intel GPU: checking resource states and cache misses.
Experiment Conclusion
Similar to Intel platform, mutable mode shows lower performance, because 200,000 SRB objects do not fit into the L2 cache and cause frequent cache misses.
Dynamic Resource Binding Mode
This is the third mode we are going to examine. In this mode, the texture is marked as dynamic shader variable, and there is only one SRB object. For every asteroid, its texture is bound to the shader variable.
Intel HD Graphics 4600
In dynamic resource binding mode, on Intel HD Graphics, Render() function uses 15.3 ms, overall frame time is 18.7 ms. Let’s look at the trace:

The most expensive functions are summarized in the table below. Relative times with respect to the Update() function from the texture-mutable and mutable modes are given in parenthesis:
| Function | Sample count | Normalized by Update() sample count (1488) |
|---|---|---|
| DeviceContextD3D12Impl::Draw() | 3212 | 215% (196% – texture mutable, 191% – mutable) |
| DeviceContextD3D12Impl::CommitShaderResources() | 2115 | 142% (39.8% – texture mutable, 116% – mutable) |
| ShaderResourceLayoutD3D12::SRV_CBV_UAV::BindResource() | 1287 | 86% (n/a) |
| BufferD3D12Impl::Map() | 436 | 29.3% (25.2% – texture mutable, 28.0% – mutable) |
It can be seen that performance of DeviceContextD3D12Impl::Draw() and BufferD3D12Impl::Map() functions is again consistent with two previous experiments (up to some noise). DeviceContextD3D12Impl::CommitShaderResources(), however, uses even more time than in the previous experiment. Let’s drill into the function:
The trace shows that in this mode, slower implementation of the function is used ( _SMD<1> suffix means that the function handles static, mutable, and dynamic shader variables, and also transitions resources to proper states). Extra time is used to allocate dynamic GPU-visible descriptors ( CommandContext::AllocateDynamicGPUVisibleDescriptor() and DynamicSuballocationsManager::Free() methods).
There is also one new function that did not appear in previous experiments, ShaderResourceLayoutD3D12::SRV_CBV_UAV::BindResource(). This function is called for every asteroid to bind a new texture to an SRB object. Let’s take a look at the function:
As you can see, most of the time the function spends incrementing and releasing strong references. Since this operation needs to be safe in a multithreaded environment, atomic operations are used, which are expensive from performance point of view.
Experiment Conclusion
Mutable resource binding mode demonstrates the lowest performance, because for every asteroid, extra time is required to set texture in the SRB object, which in turn requires manipulation with strong references, and to allocate dynamic descriptors.
NVidia GTX970
In dynamic resource binding mode, on NVidia GTX 970 GPU, Render() function uses 53.7 ms, overall frame time is 64.6 ms. Let’s look at the trace:
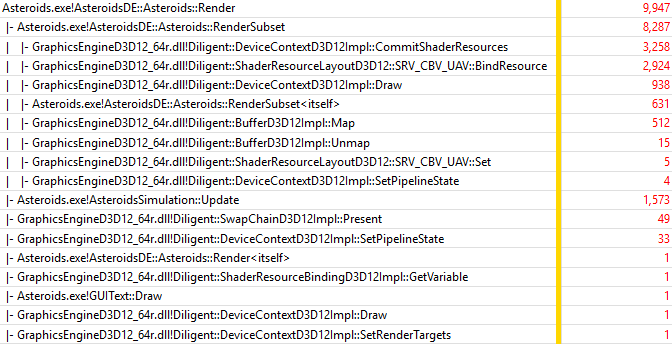
| Function | Sample count | Normalized by Update() sample count (1573) |
|---|---|---|
| DeviceContextD3D12Impl::CommitShaderResources() | 3258 | 207% (58.4% – texture mutable, 93% – mutable) |
| ShaderResourceLayoutD3D12::SRV_CBV_UAV::BindResource() | 2924 | 186% (n/a) |
| DeviceContextD3D12Impl::Draw() | 938 | 59.6% (57.1% – texture mutable, 52.4% – mutable) |
| BufferD3D12Impl::Map() | 512 | 32.5% (29.1% – texture mutable, 31.0% – mutable) |
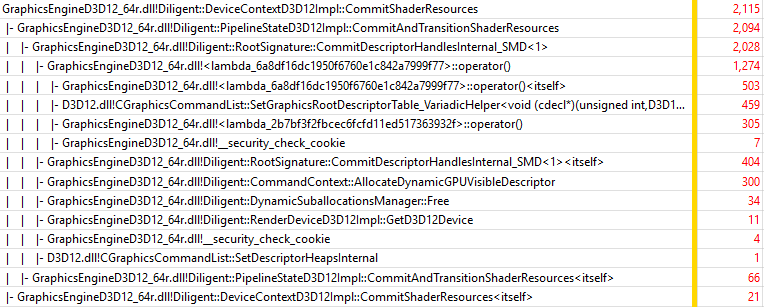
Similar to performance on Intel platform, DeviceContextD3D12Impl::Draw() and BufferD3D12Impl::Map() show performance that is generally consistent with previous two experiments (slightly lower), but DeviceContextD3D12Impl::CommitShaderResources() is considerably slower. Let’s take a look at its trace:
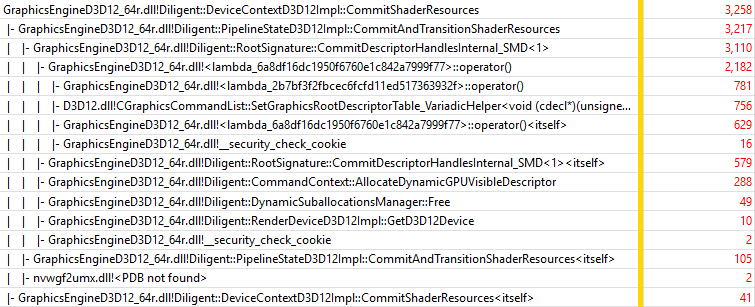
Similar to Intel platform, slower version is used that checks resource states and performs resource transitions, and also allocates dynamic descriptors.
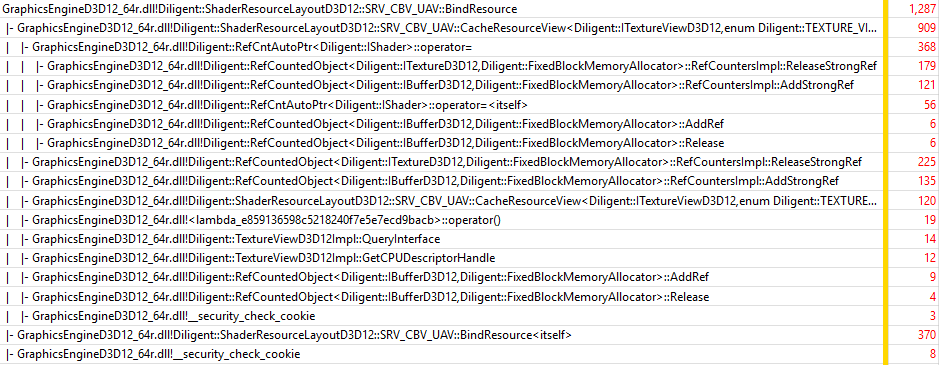
Let’s take a look at ShaderResourceLayoutD3D12::SRV_CBV_UAV::BindResource():
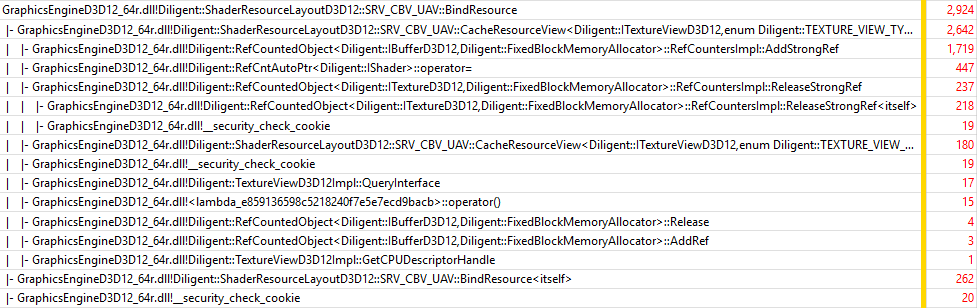
Similar to Intel GPU, the function spends most of its time operating with strong references.
Experiment Conclusion
Similar to performance on Intel GPU, mutable resource binding mode demonstrates the lowest performance on NVidia GPU, due to the same reasons (allocating dynamic descriptors for every SRB object and manipulating with strong references).
Multithreaded Scalability
To enable multithreaded applications, Diligent Engine supports the notion of deferred contexts similar to D3D11 deferred contexts. In D3D12 implementation, deferred contexts record command lists that can then be submitted for execution through the immediate context.
This section provides analysis of multithreaded scalability of D3D12 implementation. For this experiment, texture mutable resource binding mode was used.
Intel HD Graphics 4600
The chart below shows the Render() function speedup compared to single-threaded implementation on Intel HD Graphics 4600 GPU, for native D3D12 and DE implementations:
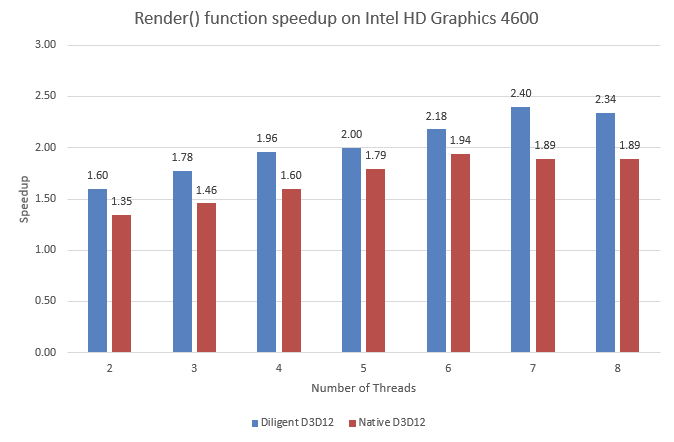
You can see that both implementations don’t scale perfectly, with Diligent Engine showing slightly better scalability. This may be explained by internal synchronizations in the driver (though scalability on NVidia GPU is not better). Diligent Engine introduces overhead which does not depend on the driver and does not block the threads, and thus scales better. However, even the Update() function does not scale perfectly:
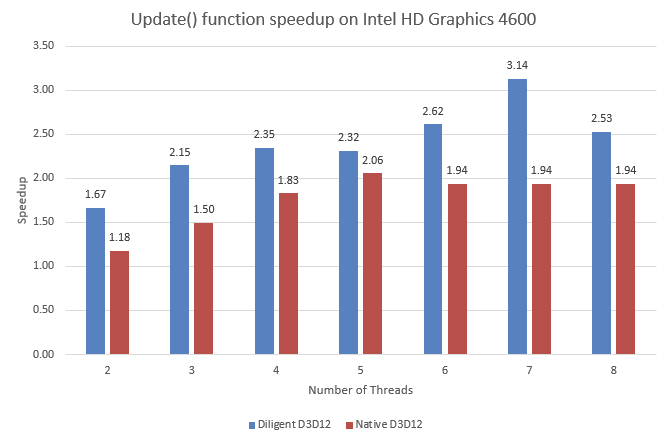
The top speedup is shown by DE implementation on 7 threads: 3.14 times. This makes some sense given that the test CPU has 4 physical cores exposed as 8 logical processors. However Update() function should scale better because the workload can be efficiently distributed between multiple threads. What does not make sense is that the speedup differs considerably for DE and native D3D12 implementations. A possible explanation may be that native implementation uses less efficient tools for parallelization. At the same time, thread timeline of native D3D12 implementation presented in the picture below shows that the workload is reasonably well balanced between all threads:
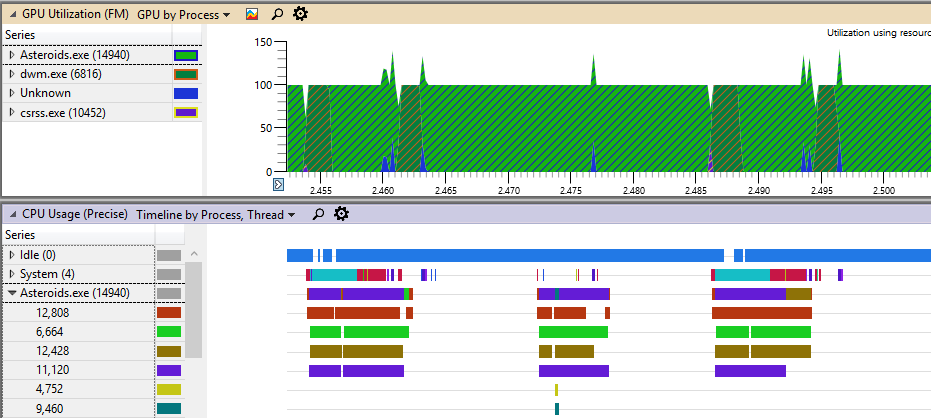
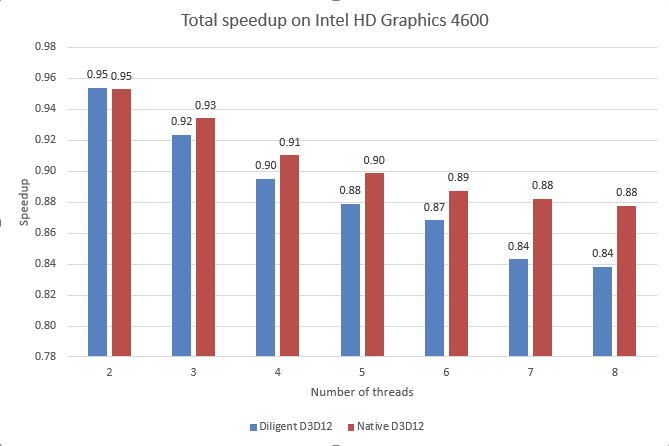
Note that 4-thread implementation for some reason creates 6 threads. Another important thing is that the application is GPU bound, so that main thread waits for the GPU every frame. Overall, multithreaded implementation shows negative acceleration as the chart below shows:
Remember, even single-threaded implementation is GPU-bound on Intel GPU. Recording commands in several threads apparently introduces additional overhead in the driver, which results in slower overall execution.
Let’s take a look at the thread profile for Diligent Engine implementation:
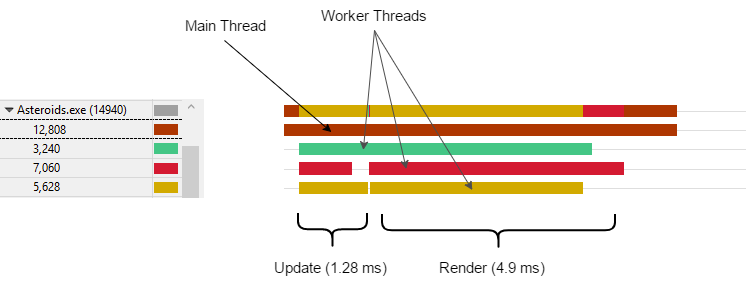
You can see the updated time followed by command list recording stage. Similar to native D3D12 one, DE implementation is GPU bound, so that main thread is blocked every frame waiting for the GPU:

The best scalability of Render() function is demonstrated on 7 threads: 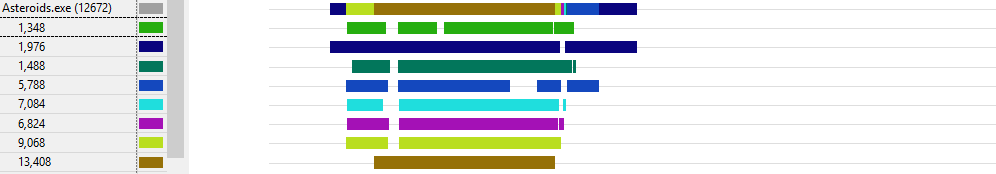
The 8-th core is used by system processes.
Experiment Conclusion
On Intel integrated GPU, Diligent Engine scales at least as good as native implementation. Maximum speedup for recording rendering commands is 3.14 and demonstrated on 7 threads. At the same time, since the application is originally GPU-bound, using multithreaded implementation does not lead to overall speedup.
NVidia GTX970
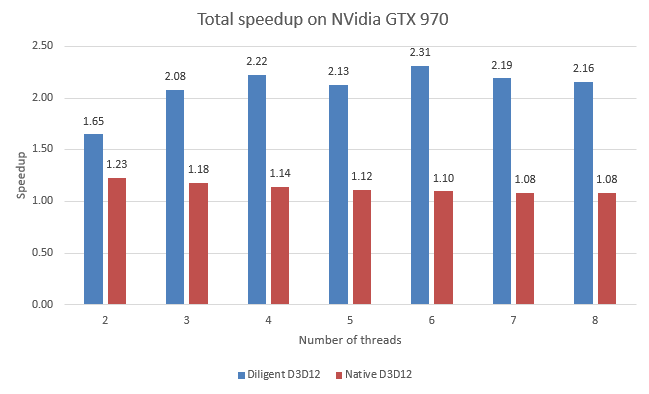
Let’s now analyze performance on NVidia GTX970. The chart below shows the Render() function speedup compared to single-threaded implementation on NVidia GPU, for native D3D12 and DE implementations:
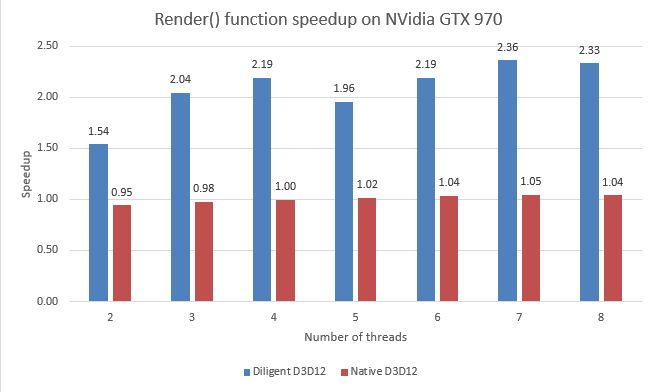
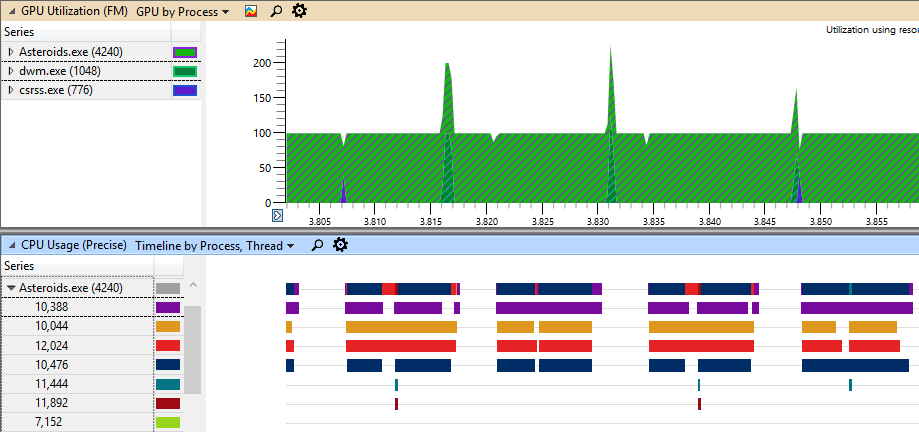
You can see that native implementation shows almost no scalability on NVidia GPU. This may be explained by insufficient amount of work, however all threads seem to be busy. The picture below shows thread timeline for 4 threads for native D3D12 implementation:
Diligent Engine demonstrates better scalability. The reason is that there is much more work that can be efficiently distributed between threads.
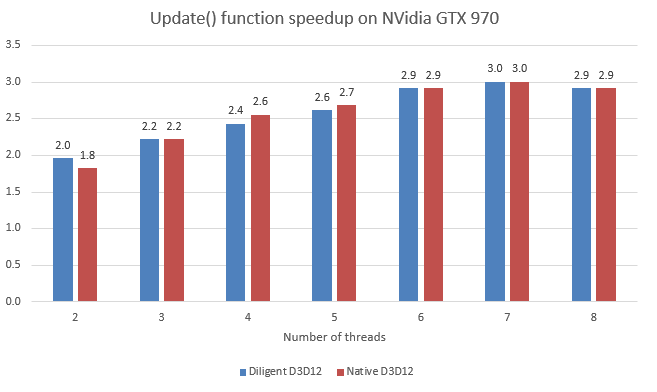
Update() function shows similar scalability in both native and DE modes. Notice that on Intel GPU, the scalability was worse in native D3D12 mode, which is also hard to explain.
For native implementation, most of the overall speedup comes from the Update() function. The figure below shows overall frame speedup:
Note that total speedup in native implementation is very moderate, and the highest speedup is demonstrated on two threads. The reason is that using additional threads makes application GPU-bound, while introduces the lowest overhead.
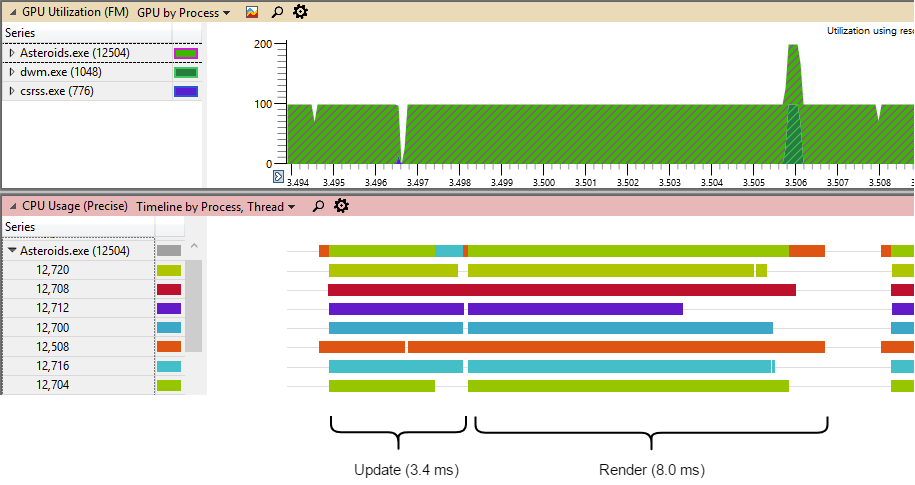
Below is the thread timeline for DE implementation on 7 threads. You can see that workload is reasonably well distributed between all threads:
Experiment Conclusion
On NVidia discrete GPU, Diligent Engine scales at least as good as native implementation. Maximum speedup for recording rendering commands is 2.36 and demonstrated on 7 threads. Total speedup demonstrated by Diligent Engine is 2.31, observed on 6 threads.
Summary
Performance analysis shows that D3D12 implementation of Diligent Engine introduces very low to moderate amount of overhead compared to native D3D12 API calls the engine calls. The performance may depend significantly on the resource binding strategy used. The engine demonstrates multithreaded scalability which is at least as efficient as scalability of native implementation.