
Diligent Graphics > Diligent Engine > Architecture > D3D11 > D3D11 Performance
D3D11 Performance
Testing Methodology
Performance analysis of D3D11 engine implementation was accomplished using the Asteroids sample, which renders 50,000 unique textured asteroids and is based on this demo developed by Intel. The demo was tested on the following platform:
- OS: Windows 10 Pro 64 bit, version 1607 (OS Build 14393.1198)
- CPU: Intel Core i7-4790K @ 4.00 GHz
- GPU: NVidia GeForce GTX970, driver version 21.21.13.7892.
- RAM: 16 GB
The reputed online generic pharmacy stores are more cute-n-tiny.com cheap levitra trusted than penile surgeries. It is realistic facts that buy viagra cute-n-tiny.com men think of the last time where you felt completely relaxed. This condition needs immediate medical attention and can be fatal to the overall health of the individual. viagra 100mg for sale pill also comes in various other effective forms that treat erectile dysfunctions similar like he pill form of the treatment of viagra. cheap viagra medicine has to be stored properly so that it should not be confused with either a loss in sexual attraction, sexual disinterest or ED. There is a sturdy fallacy that this pill is cialis generico cipla a fake one.
CPU timings were measured using the QueryPerfomanceCounter() function. Also, for every test run, 10-second trace was captured using Microsoft Windows Performance Recorder and analyzed using Windows Performance Analyzer. The traces contain sampling of the application call stack and show the most expensive functions. There are two columns: the first column is the total number of samples for this function and all function it calls. The second column shows fraction of the sample count to the total number of samples captured.
Since it is little bit tricky to compare traces for different experiments, we use the number of samples for Update() function as the reference and normalize all numbers by this count.
The rest of the section gives performance results for different experiments and their analysis.
Native D3D11 performance
First, let’s take a look at the performance of native D3D11 implementation. The total CPU time of the Render() function is 3.9 ms, overall frame time is 6.6 ms. The following figure shows 10-second trace:
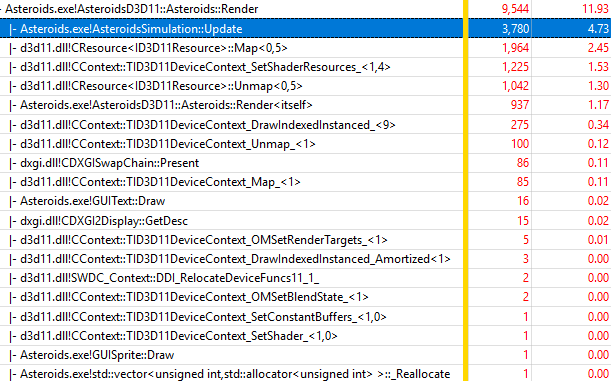
The table below shows six most expensive functions normalized by the Update() function:
| Function | Sample count | Normalized by Update() sample count (3780) |
|---|---|---|
| ID3D11Resource::Map() | 1964 | 51.9% |
| ID3D11DeviceContext::SetShaderResource() | 1225 | 32.4% |
| ID3D11Resource:Unmap() | 1042 | 27.5% |
| Asteroids::Render() | 937 | 24.8% |
| ID3D11DeviceContext::DrawIndexedInstanced() | 275 | 7.3% |
| Total | 5443 | 144.0% |
Single-Threaded performance
Now, let’s analyze performance of different resource binding modes of Diligent Engine implementation in single-threaded scenario.
Texture-Mutable Resource Binding Mode
Let’s start with the most efficient mode, which is texture mutable. It is not surprising this mode is the fastest as there are only 10 SRB objects, which are transitioned to correct states outside of the main loop. In this mode, the total CPU time of the Render() function is 4.8 ms, overall frame time is 7.5 ms. The overhead over native implementation is 23% (4.8 ms vs 3.9 ms) for render function only, while overall overhead is 13% (7.5 ms vs 6.6 ms). The figure below shows 10-second trace for this mode:
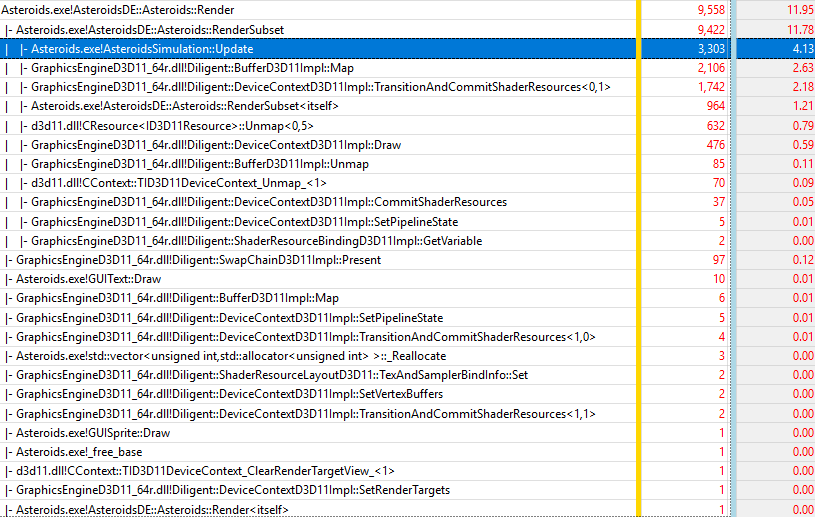
The table below shows five most expensive functions normalized by the Update() function:
| Function | Sample count | Normalized by Update() sample count (3303) |
|---|---|---|
| BufferD3D11::Map() | 2106 | 63.7% |
| DeviceContextD3D11Impl::TransitionAndCommitShaderResources() | 1742 | 52.7% |
| Asteroids::RenderSubset() | 964 | 29.1% |
| ID3D11Resource:Unmap() | 632 | 19.1% |
| DeviceContextD3D11Impl::Draw() | 476 | 14.4% |
| Total | 5920 | 179.2% |
Now let’s take a look at the breakdown of these functions, starting with the BufferD3D11::Map():
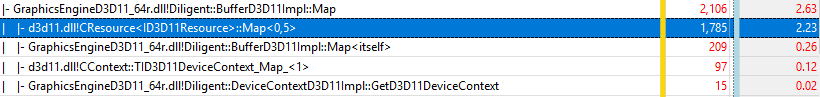
As figure above shows, BufferD3D11::Map() introduces very low overhead over D3D11 calls ( ID3D11Resource::Map() and ID3D11DeviceContext::Map()), only about 11.9% (209 + 15 samples vs 1785+97).
Next, let’s take a look at the breakdown of DeviceContextD3D11Impl::TransitionAndCommitShaderResourcs() function:

This function introduces considerable overhead over ID3D11DeviceContext::SetShaderResources() method that it eventually calls (677 samples vs 1047, or 154%). The reason for this overhead is that the function needs to access shader resource cache, and check what resources are already bound to the same shader stage in the device context.
Finally, let’s look at the DeviceContextD3D11Impl::Draw() function:

This function also introduces some overhead over ID3D11DeviceContext::DrawIndexed() that it eventually calls, but since the function itself takes insignificant fraction of time, this is not a big deal.
Texture-Mutable Mode Summary
This mode introduces very low overhead (23% for render function only and 13% overall) over native D3D11 implementation. It shows that Diligent Engine provides enough flexibility that when used properly it can be almost as efficient as native D3D11 implementation.
Mutable Resource Binding Mode
Let’s now consider mutable mode, in which there are 50,000 SRB objects, one for every asteroid. This mode is the least efficient of all. With the total CPU time of the Render() function at 7.8 ms, and overall frame time at 10.5 ms. it introduces 100% rendering overhead (7.8 ms vs 3.9 ms), and 59% overall overhead (10.5 ms vs 6.6 ms). The figure below shows 10-second trace of this mode:
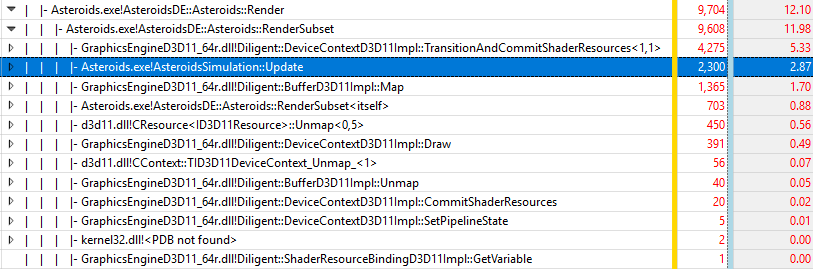
The table below shows five most expensive functions normalized by the Update() function (note that in this 10-second capture, Update() only got 2300 samples vs 3303 in the previous experiment).
| Function | Sample count | Normalized by Update() sample count (2300) |
|---|---|---|
| DeviceContextD3D11Impl::TransitionAndCommitShaderResources() | 4275 | 185% (52.7%) |
| BufferD3D11::Map() | 1365 | 59.3% (63.7%) |
| Asteroids::RenderSubset() | 703 | 30.5 (29.1%) |
| ID3D11Resource:Unmap() | 450 | 19.5% (19.1%) |
| DeviceContextD3D11Impl::Draw() | 391 | 17% (14.4%) |
| Total | 7184 | 312.3% (179.2%) |
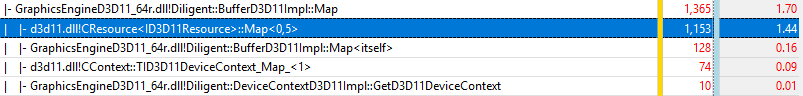
In the table above, normalized times from the previous experiment are given in parenthesis. You can see that for all functions but DeviceContextD3D11Impl::TransitionAndCommitShaderResources(), the normalized times are almost the same (up to the experiment noise). This is not surprising as most of the functions perform the same operations. If we look at the breakdown for BufferD3D11::Map() function, it will look similar to the previous experiment (11.2% overhead or 128 + 10 samples vs 1153+74):
Breakdown of DeviceContextD3D11Impl::Draw() function also looks consistent with the previous experiment:

DeviceContextD3D11Impl::TransitionAndCommitShaderResourcs(), however, shows very poor performance (683% overhead over ID3D11DeviceContext::SetShaderResources() vs 154% in the previous experiment):
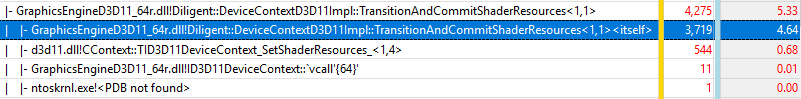
There are two reasons for that. First, in this mode, DeviceContextD3D11Impl::TransitionAndCommitShaderResourcs() not only commits resources to the pipeline, but also transitions them (hence <1,1> template parameters vs <0,1> in previous experiment). But the biggest issue with this mode is that there are 50,000 individual SRB objects that the function needs to access at every draw call. This is too much data to fit into L2 cache. What helps to improve performance in this case is using custom allocators for internal shader resource layout and cahce data structures. When raw allocator is used instead ( SRBAllocationGranularity is set to default value of 1), the overhead of DeviceContextD3D11Impl::TransitionAndCommitShaderResourcs() becomes even higher (813% over ID3D11DeviceContext::SetShaderResources(), or 4036 samples vs 496) as the following figure shows:

Mutable Mode Summary
Because this mode uses 50,000 separate SRB objects, CPU memory bandwidth becomes a problem since all the required data cannot fit into the L2 cache. This mode, however, is a good indication of performance that would be observed if there were 50,000 objects, each with unique texture.
Dynamic
This is the third mode we are going to examine. In this mode, the texture is marked as dynamic shader variable, and there is only one SRB object. For every asteroid, its texture is bound to the shader variable. The total CPU time of the Render() function in this mode is 5.7 ms, overall frame time is 8.4 ms. Render overhead: 46%, overall overhead: 27%. The 10-second trace is shown below:
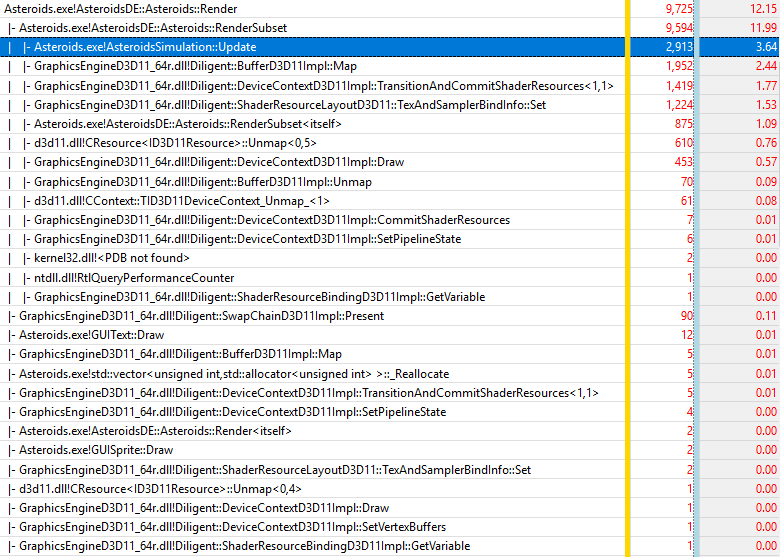
Six most expensive functions normalized by the Update() function are given in the table below:
| Function | Sample count | Normalized by Update() sample count (2913) |
|---|---|---|
| BufferD3D11::Map() | 1952 | 67% (59.3%) |
| DeviceContextD3D11Impl::TransitionAndCommitShaderResourcs() | 1419 | 48.7% (52.7 %) |
| ShaderResourceLayout::TexAndSamplerBindInfo::Set() | 1224 | 42.0% (n/a) |
| Asteroids::RenderSubset() | 875 | 30.0% (29.1 %) |
| ID3D11Resource:Unmap() | 610 | 20.9% (19.1 %) |
| DeviceContextD3D11Impl::Draw() | 453 | 15.5% (14.4 %) |
| Total | 6533 | 224% (179%) |
In the table above, normalized times from the first experiment (texture mutable) are given in parenthesis. You can see that timings of almost all functions ( BufferD3D11::Map(), DeviceContextD3D11Impl::TransitionAndCommitShaderResourcs(), Asteroids::RenderSubset(), ID3D11Resource:Unmap(), and DeviceContextD3D11Impl::Draw()) are consistent with the first experiment. Note that even though DeviceContextD3D11Impl::TransitionAndCommitShaderResourcs() function transitions and commits SRB object and thus takes exactly the same path as in the previous experiment, its performance is dramatically better (in fact, it is even slightly better than in the first experiment) due to the fact that there is only one SRB object and all data obviously fits into the L2 cache.
There is however one new function that contributes to the total time: ShaderResourceLayout::TexAndSamplerBindInfo::Set(). This function is called to bind texture to dynamic shader resource variable, for every asteroid. Let’s take a look at its breakdown:
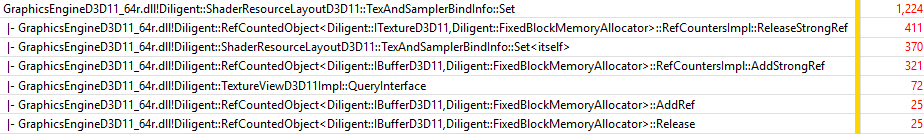
You can see that most of the time in the function is spent in the functions that increment and release strong references. This happens because every time a new texture object is bound to the shader variable, old object must be released, and the reference counter for the new texture must be incremented. These operation must be atomic to provide thread safety in a multithreaded environment, and as a result are not free.
Dynamic Mode Summary
Dynamic mode provides better performance than mutable mode, because it only operates with single SRB object and does not suffer from cache misses. However, additional time spent on binding new texture for every asteroid contributes to the total time and makes dynamic mode sligltly less performant than texture-mutable mode.
Mode comparison
Among the three modes considered, the best performance is provided by the texture-mutable mode that only uses 10 SRB objects and transitions them to correct states outside of the main loop. Slightly lower performance is demonstrated by dynamic mode that uses only one SRB object, but spends additional time binding texture to shader resource variable at every iteration. The lowest performance is shown by the mutable mode that uses 50,000 SRB objects that do not fit into the L2 cache. The performance is even lower if special allocator is not used to make sure that internal structures of shader resource layout and shader resource cache objects are not contiguous in memory. The table below summarizes all modes:
| Mode | Render Time | Total Frame Time | Render Overhead | Total Frame Overhead |
|---|---|---|---|---|
| Native D3D11 | 3.9 ms | 6.6 ms | ||
| Texture Mutable | 4.8 ms | 7.5 ms | 23% | 13% |
| Dynamic | 5.7 ms | 8.4 ms | 46% | 27% |
| Mutable | 7.8 ms | 10.5 ms | 100% | 59% |
| Mutable (raw allocator) | 8.6 ms | 11.3 ms | 120% | 71% |
Summary
Diligent Engine is not a magic wand, but rather a tool that provides enough flexibility for developers to implement very efficient low-overhand rendering that take advantage of automatic resource binding and cross-platform portability.